Lab 5: Gene Expression & Transcriptome Analysis
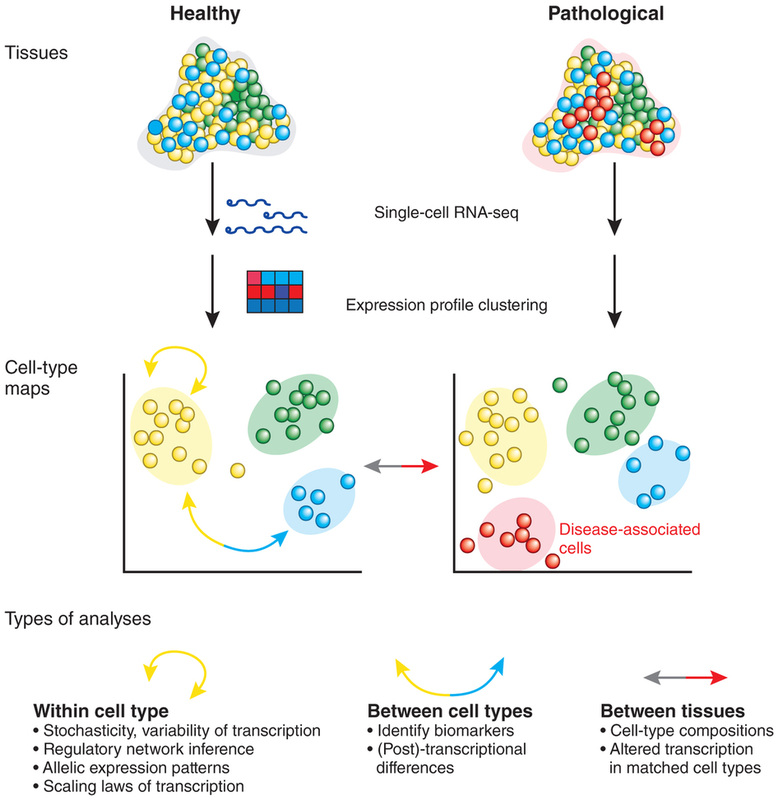
Example of a RNA-Seq experiment
|
Things to look at:
Many of these tutorials are found at the Genetics Learning site at the Univ of Utah Measuring Gene Expression DNA MicroArray Precision Medicine | ||
Websites:
|
1. GEO Profiles
The GEO Profiles database stores gene expression profiles derived from curated GEO DataSets. Each Profile is presented as a chart that displays the expression level of one gene across all Samples within a DataSet. Experimental context is provided in the bars along the bottom of the charts making it possible to see at a glance whether a gene is differentially expressed across different experimental conditions. 2. GEO Datasets The GEO DataSets database stores original submitter-supplied records (Series, Samples and Platforms) as well as curated DataSets. Curated DataSets form the basis of GEO's advanced data display and analysis features, including tools to identify differences in gene expression levels and cluster heatmaps. You can select the Gene List and then paste into PANTHER. Example: search disease (breast cancer) and click on Datasets in the left corner to find datasets with a heatmap you can peruse. Then try your own disease here. Note---most of you will not find what you are looking for as it has not been done before. The goal of this is to show you how to mine the data for information that you can get ideas from. 3. PANTHER search for GO terms corresponding to genes that you find unregulated or down regulated with your gene : http://pantherdb.org
4. The Human Protein Atlas: visually appealing database of gene expression both RNA and Protein + localization. There might be some images and info you can use from here.
|
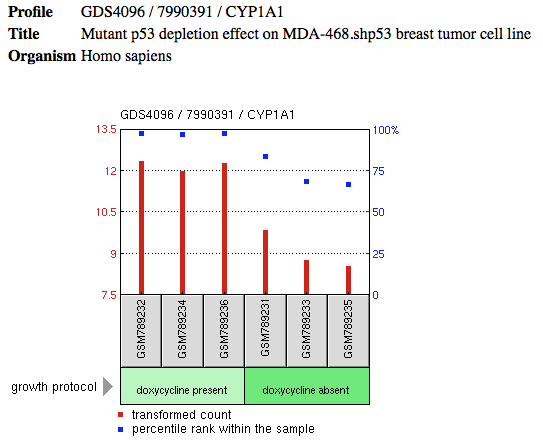
example of a GEO profile for the CYP1A1 gene
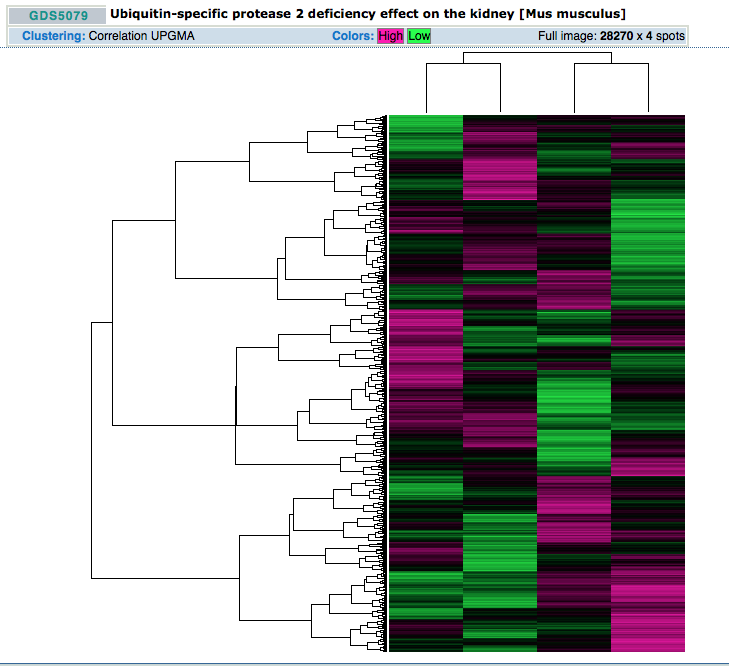
example of a heat map found using GEO datasets
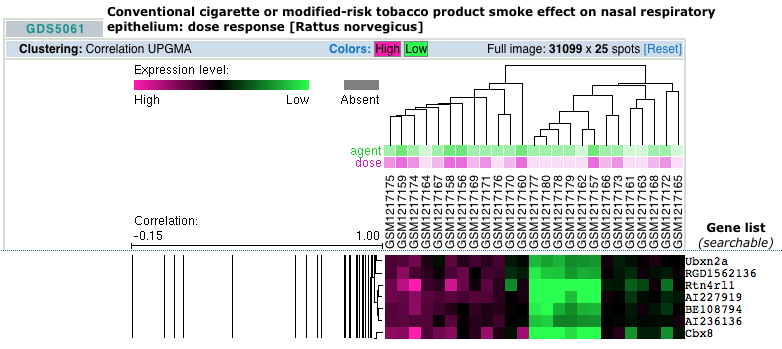
zoom up of heat map to see genes
|